


This use case shows how TCN Ethernet SimulatorTM is used to simulate a simple financial trading scenario. With the help of video clips and screenshots it is shown how utilization and hotspots are discovered and how response-time analysis will assist you in creating robust networks.
There are in total four simulation scenarios described below, showing how a working configuration is found in the end.
The following three video clips (of about 1 min each) show how the system is setup:
Video clip 1, 2 and 3 (~1 minute each)
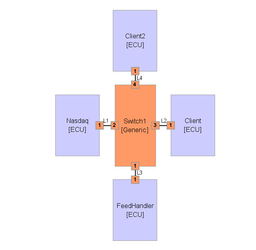
Market data flows from NASDAQ to FeedHandler and further down to the Client.
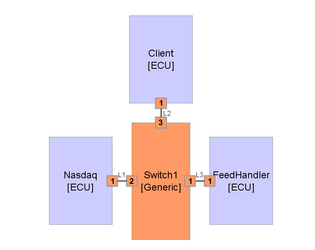
Order data flows from the Client to the FeedHandler. Possible congestion on Switch1.Port1.EI which is the switch port that is connected to the FeedHandler.
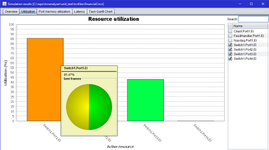
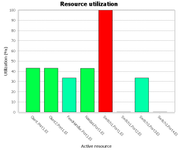
The link utilization is around 85% as can be seen in the Resource Utilization window.
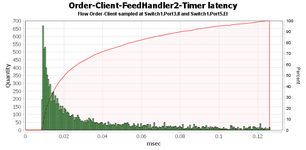
The Latency Charts reflect that sometimes the data flowing through the egress interface Switch1.Port1.EI has to wait for another frame to complete transmission.
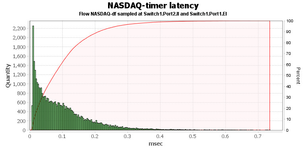
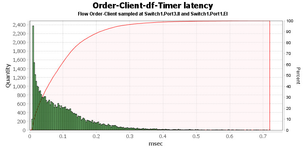
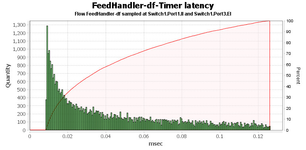
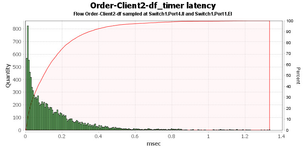
The latency for the market data (NASDAQ) is at worst 0.7 ms, but most of the Ethernet frames are delivered in less than 200 microseconds. The same goes for the other data flow (Order-Client-df-Timer) that is passing through the same switch port. Data from the FeedHandler down to the client runs smoothly without any disturbances.
A second client is added that will send its orders to the FeedHandler as well.
Video clip 4 - additional client added
The resulting topology now looks like this:
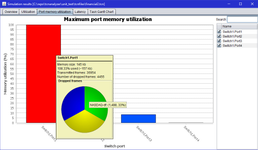
The simulation shows us that the Switch1.Port1.EI is now at its maximum utilization and that the port memory for outgoing frames in the switch is full and the switch has actually dropped frames.
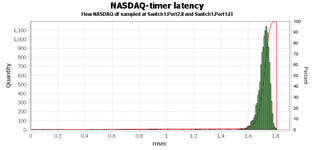
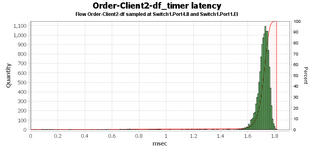
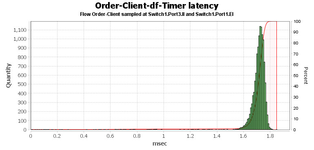
The latency for the frames flowing through the congested port now shows a max of about 1.8 ms and most of the frames have a latency between 1.6 and 1.8 ms.
To make the NASDAQ market data to be delivered without the high latency, VLANs are created and the NASDAQ data is set to high prio. There network still remains intact, no components added to the topology.
Video clip 5 - introduce VLAN and change priority
In the results we see that the market data coming from NASDAQ is now much faster. This is of course at the expense of the client data that is being sent to the FeedHandler. Since the amount of data being sent over the Switch1.Port1.EI link is the same as before we still have dropped packets and a utilization of 100%.
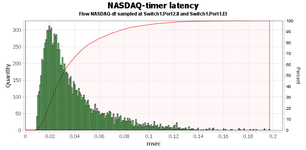
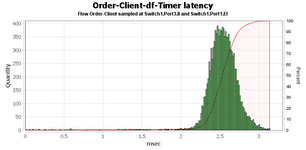
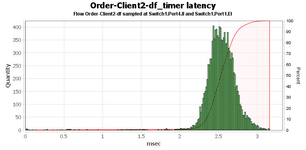
In order to remedy the situation, the FeedHandler are split into two (which may or may not be the physical case). This means that we now have two links to the FeedHandler system. The orders from Client 1 will be sent to the new FeedHandler instance (FeedHandler2).
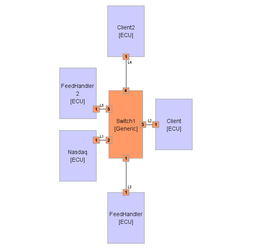
Video clip 6 - second link added
And the results are satisfactory since there are no packet drops and it shows decent latency times. The Order-Client2 shows higher latency because it still shares a link with the high prio NASDAQ data.
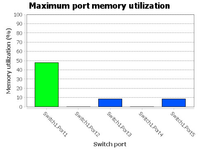
The port memory buffers in the switch look quite OK, no frame drops occurred.
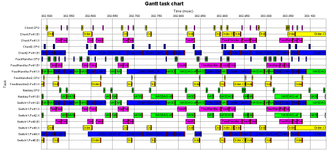
A look at the colourful Task Gantt Chart gives you an idea of how much data the system is pushing. It provides you with the opportunity to drill down and examine the timing behavior.
------------------