...
There are in total four simulation scenarios described below, showing how a working configuration is found in the end.
Set-up of network, data traffic and timers
The following three video clips (of about 1 min each) show how the system is setup:
...
Video clip 1, 2 and 3 (~1 minute each)
Initial simulation
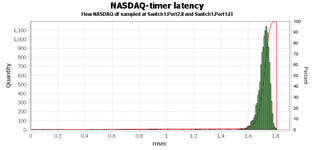
Market data flows from NASDAQ to FeedHandler and further down to the Client.
...
The latency for the market data (NASDAQ) is at worst 0.7 ms, but most of the Ethernet frames are delivered in less than 200 microseconds. The same goes for the other data flow (Order-Client-df-Timer) that is passing through the same switch port. Data from the FeedHandler down to the client runs smoothly without any disturbances.
Second simulation - additional client added
A second client is added that will send its orders to the FeedHandler as well.
...
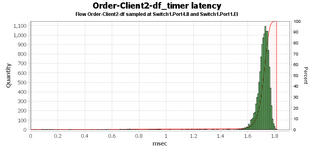
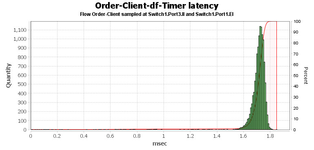
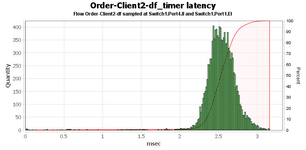
The latency for the frames flowing through the congested port now shows a max of about 1.8 ms and most of the frames have a latency between 1.6 and 1.8 ms.
Third simulation - introduce VLAN and change priority
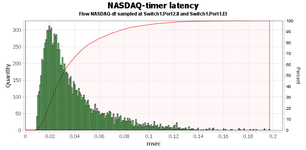
To make the NASDAQ market data to be delivered without the high latency, VLANs are created and the NASDAQ data is set to high prio. There network still remains intact, no components added to the topology.
...
In the results we see that the market data coming from NASDAQ is now much faster. This is of course at the expense of the client data that is being sent to the FeedHandler. Since the amount of data being sent over the Switch1.Port1.EI link is the same as before we still have dropped packets and a utilization of 100%.

Fourth simulation - second link added
In order to remedy the situation, the FeedHandler are split into two (which may or may not be the physical case). This means that we now have two links to the FeedHandler system. The orders from Client 1 will be sent to the new FeedHandler instance (FeedHandler2).
...